

IELTS Writing Task 1 – Table & Graph Practice
Master data description anywhere. Sample essays, essential vocabulary & step‑by‑step strategy.
Understanding Task 1
In Academic IELTS Task 1 you have 20 minutes to write at least 150 words summarising a graph, table, chart or diagram. No opinion, just facts and comparisons.
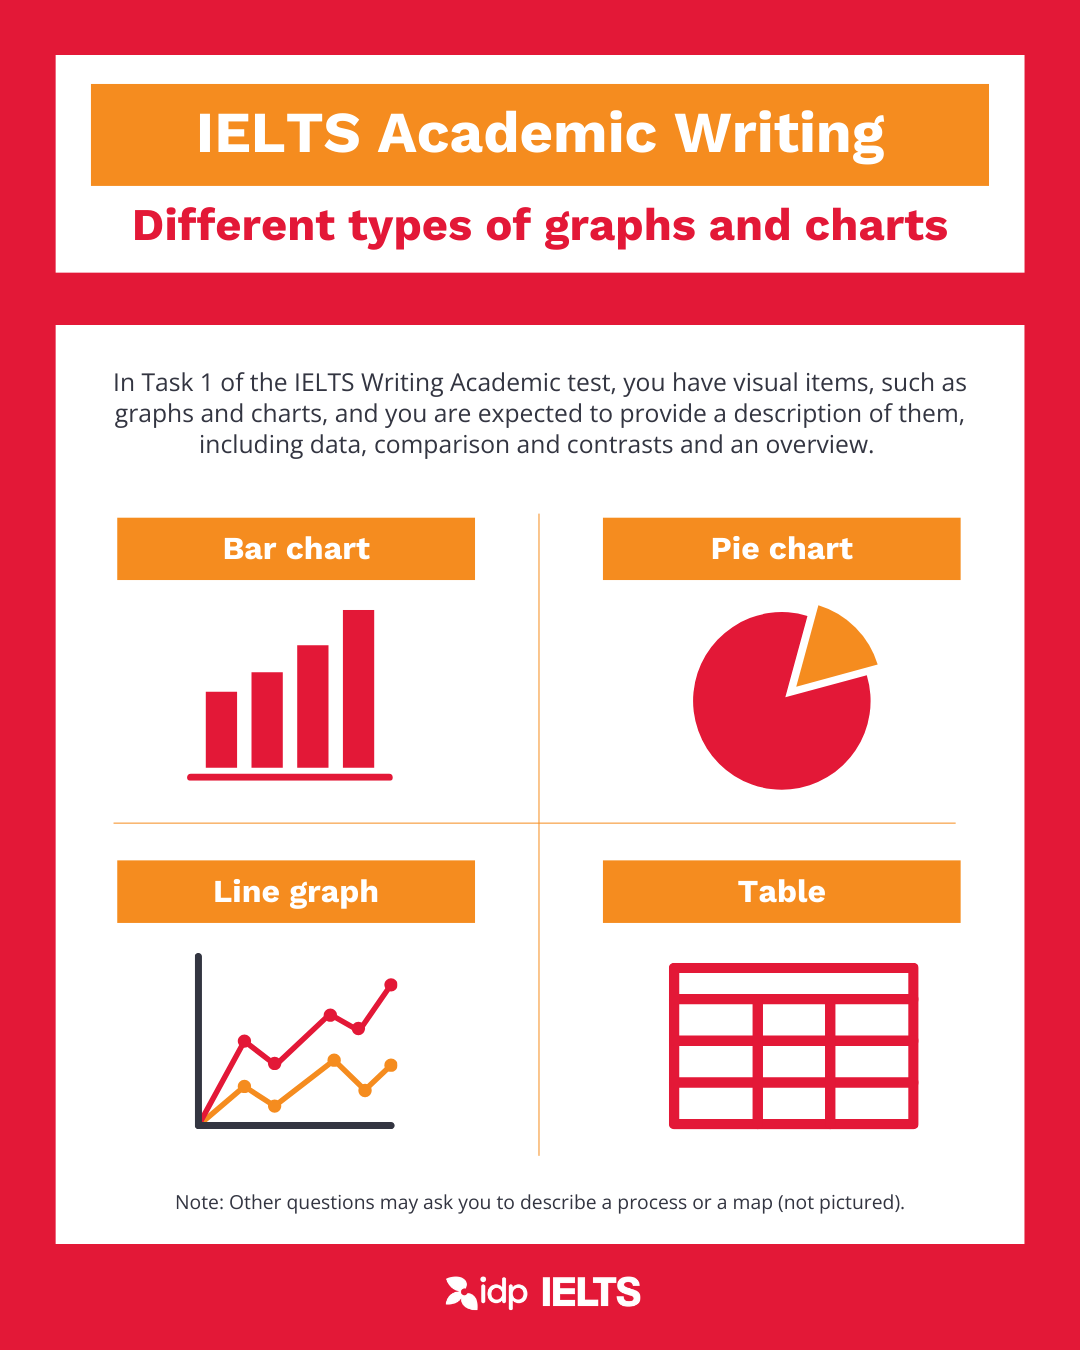
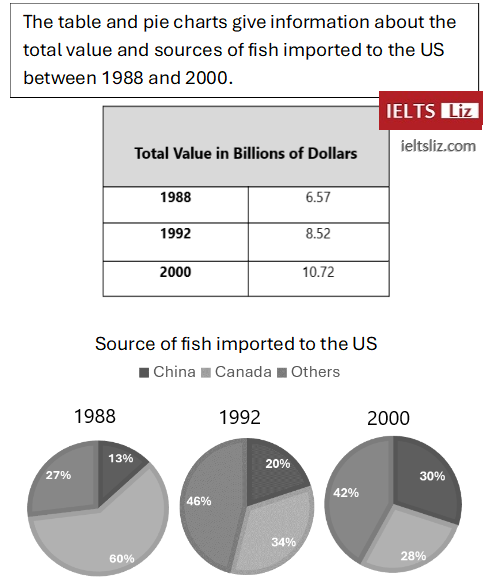
Common chart types
Structure for Band 7+
| Paragraph | Purpose | Words |
|---|---|---|
| 1. Introduction | paraphrase question | 20-30 |
| 2. Overview | main trends | 40-50 |
| 3. Details 1 | key features | 60-70 |
| 4. Details 2 | remaining data | 60-70 |
📋 Sample Band 7+ response (underground systems)
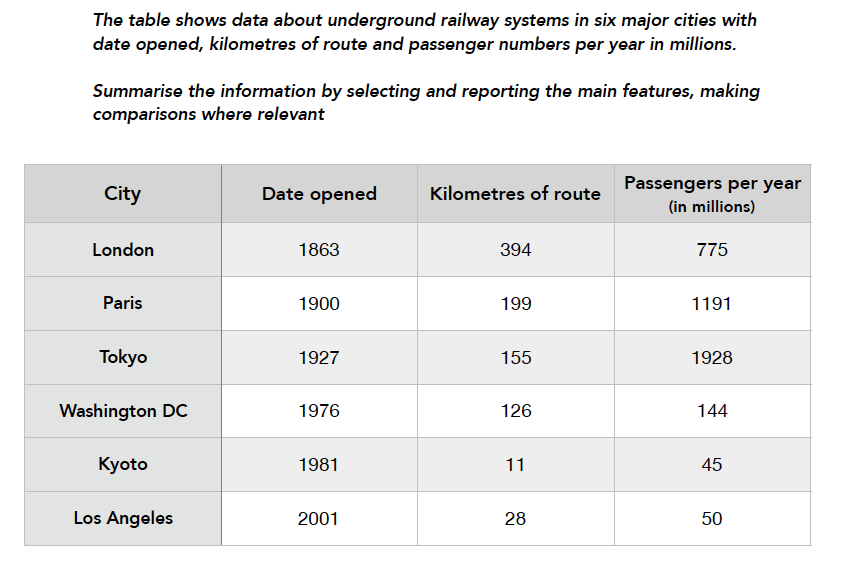
Introduction: The table gives information about metro systems in six cities, including opening year, route length and annual passengers.
Overview: London has the oldest and longest network, while Tokyo carries the most passengers. Paris, despite a shorter route, serves over a billion people.
Details: London (1863) extends 394 km and transports 775 million yearly. Paris opened in 1900, with 199 km but 1,191 million passengers. Tokyo's system (1927, 155 km) is the busiest: 1,928 million. Kyoto (1981) and Los Angeles (2001) are much smaller, with 11 and 28 km, serving 45 and 50 million respectively.
Graph description techniques

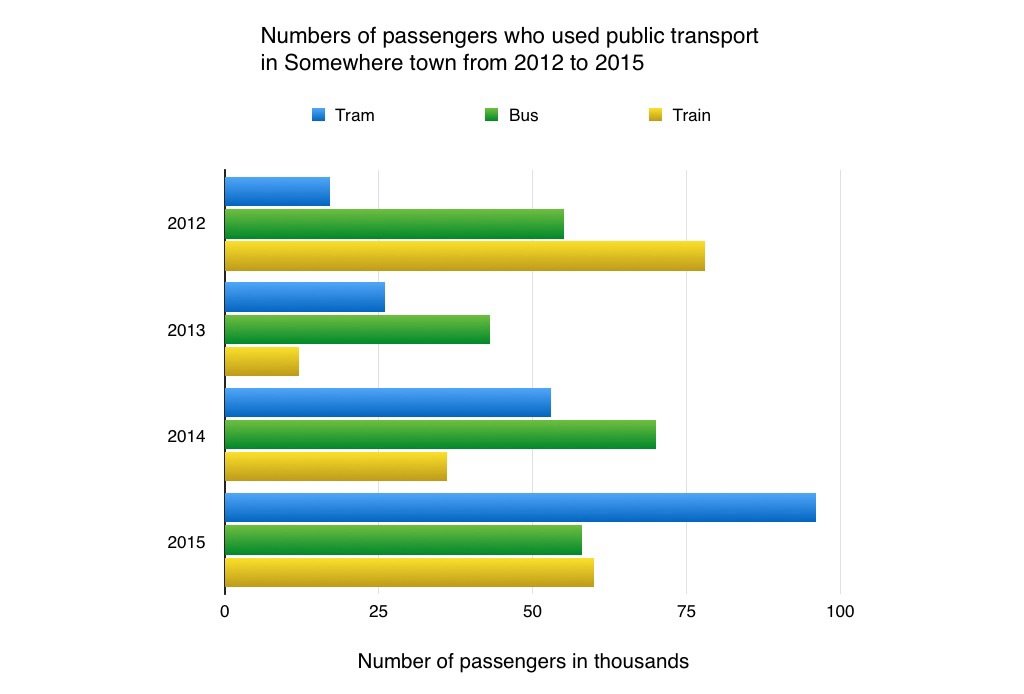
✅ Key graph tips
- spot overall trend (up/down/stable)
- use precise change vocabulary
- always include numbers
- group similar data
- avoid listing every point
Vocabulary for Band 7+
📈 increases
rise / grow / climb / surge / peak at📉 decreases
drop / decline / plummet / bottom out↔️ stability
remain stable / level off / plateau📊 fluctuations
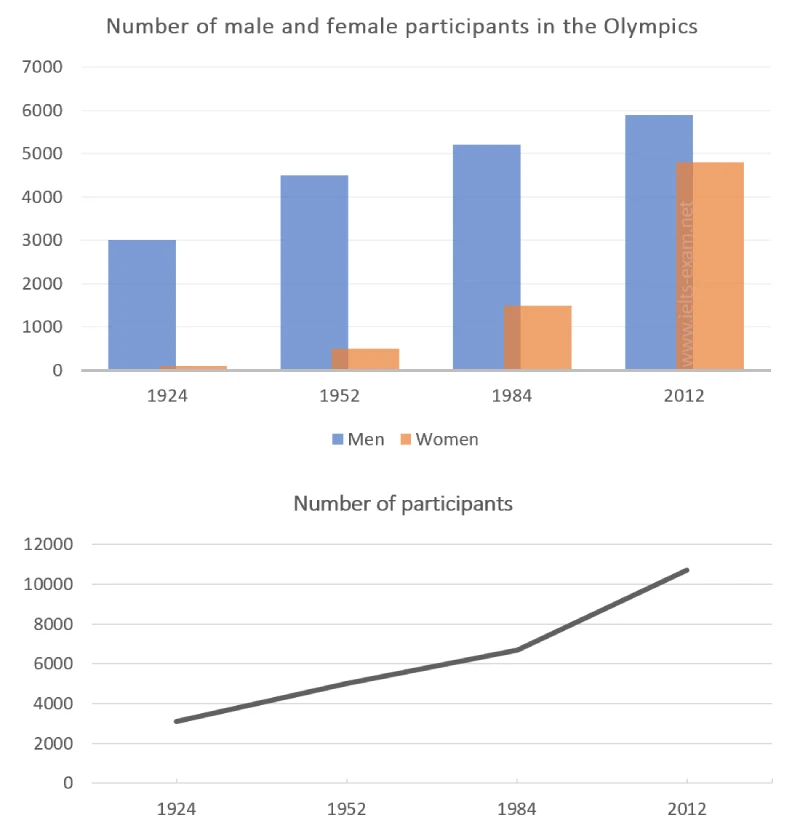
fluctuate / oscillate / volatileCombined charts
‑ less than 150 words
‑ opinion / irrelevant data
‑ no overview
‑ repetitive words
External resources
📅 Related: Day 13 (foundation) and Day 18 (Task 2) — see sidebar.


Social Plugin